Working with Graphs
Customize graphs with date ranges, aggregation, annotations, and display options.
Review progress
Open a skill or behavior to review its progress graph. Choose the dates you want to discuss, then use Session for individual results or Daily, Weekly, or Monthly to see progress over time.
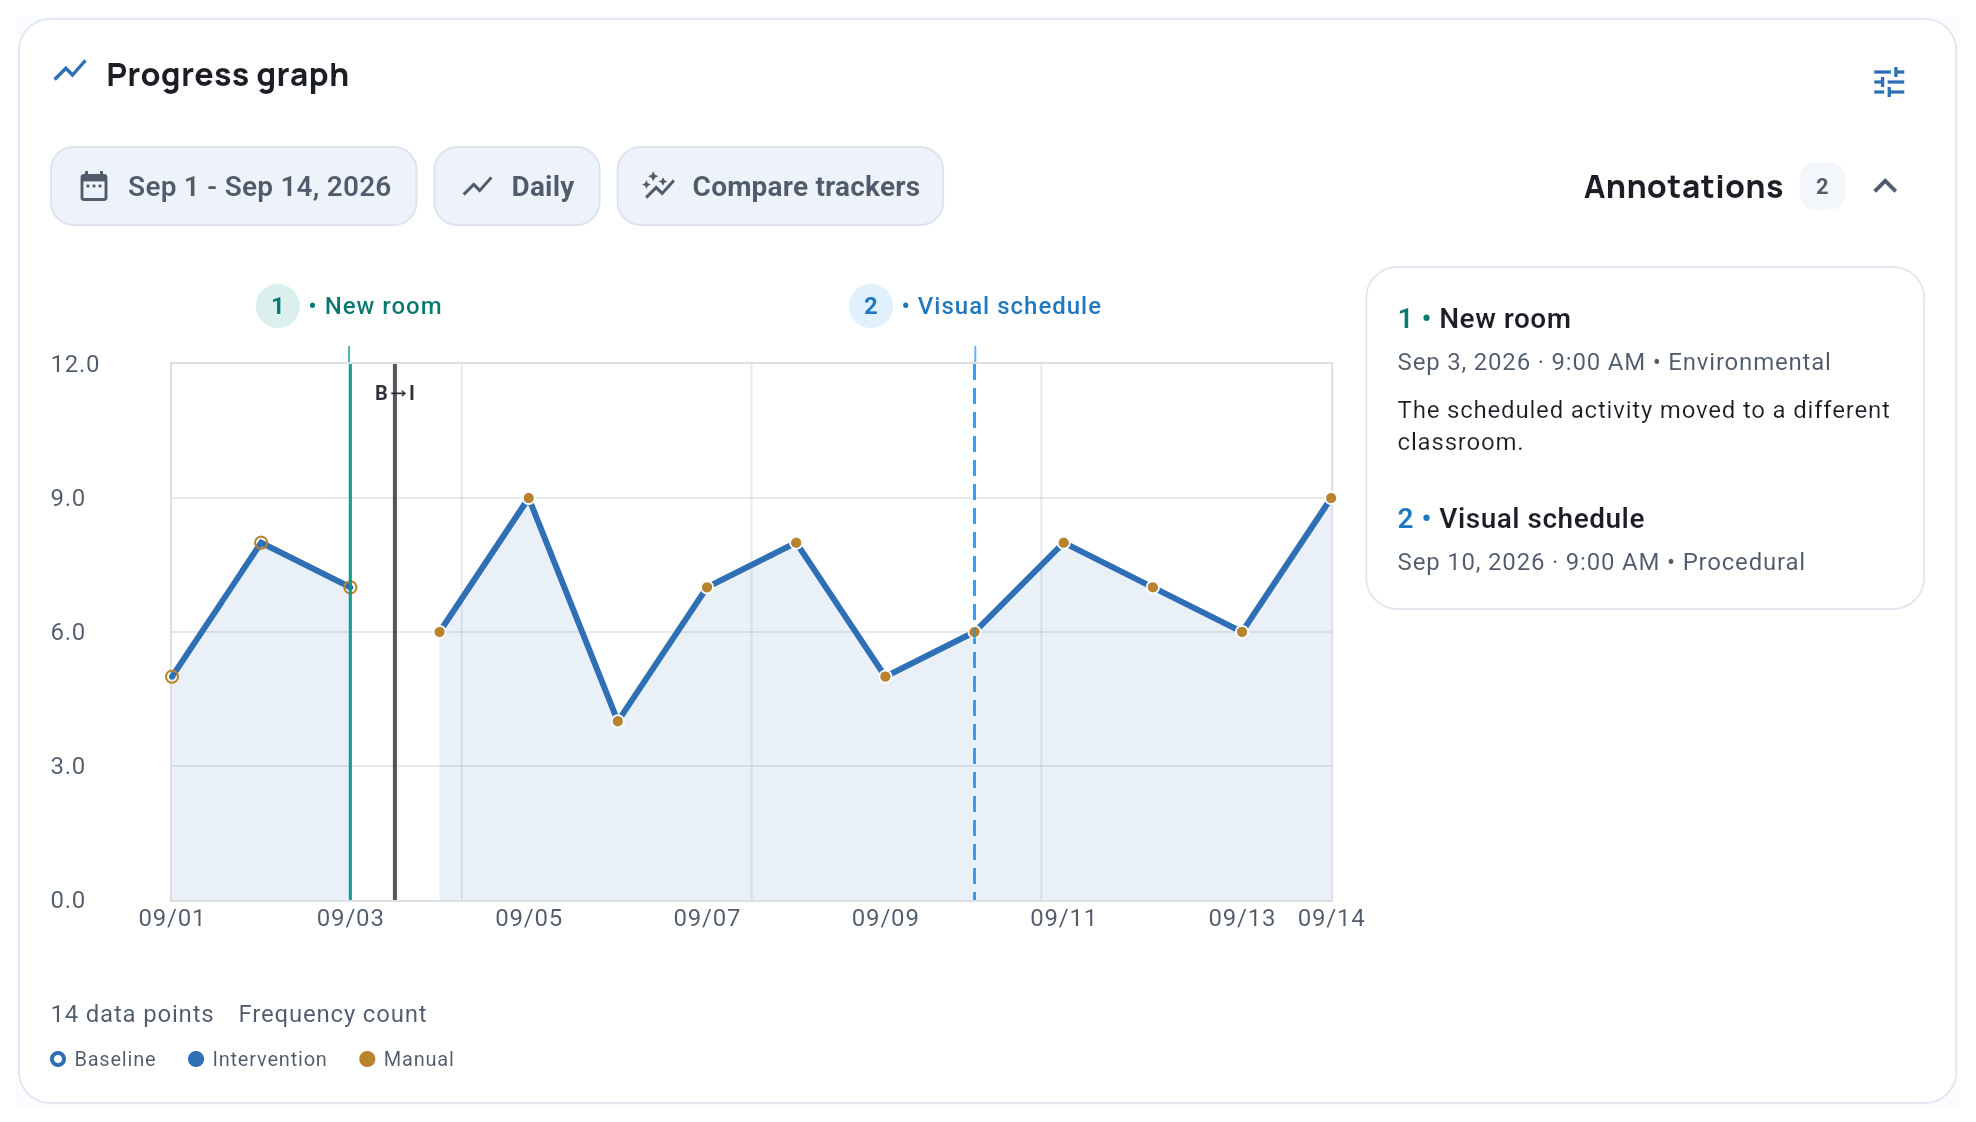
For setting or staff comparisons, choose Session. See Observation Settings for the comparison workflow.
Graph Display Options
Use the Graph settings icon to choose which graph details to show.
Criterion and benchmark shows the mastery threshold and the current objective’s optional benchmark date within the selected range. In weekly or monthly views, the date may appear below the graph. It is a planning reference, not an observed result. Set a benchmark date.
Annotations
Keep context, such as a new room or schedule change, with the data. Open Annotations for the full details; numbered markers match the entries in this list when names cannot fit on the graph.
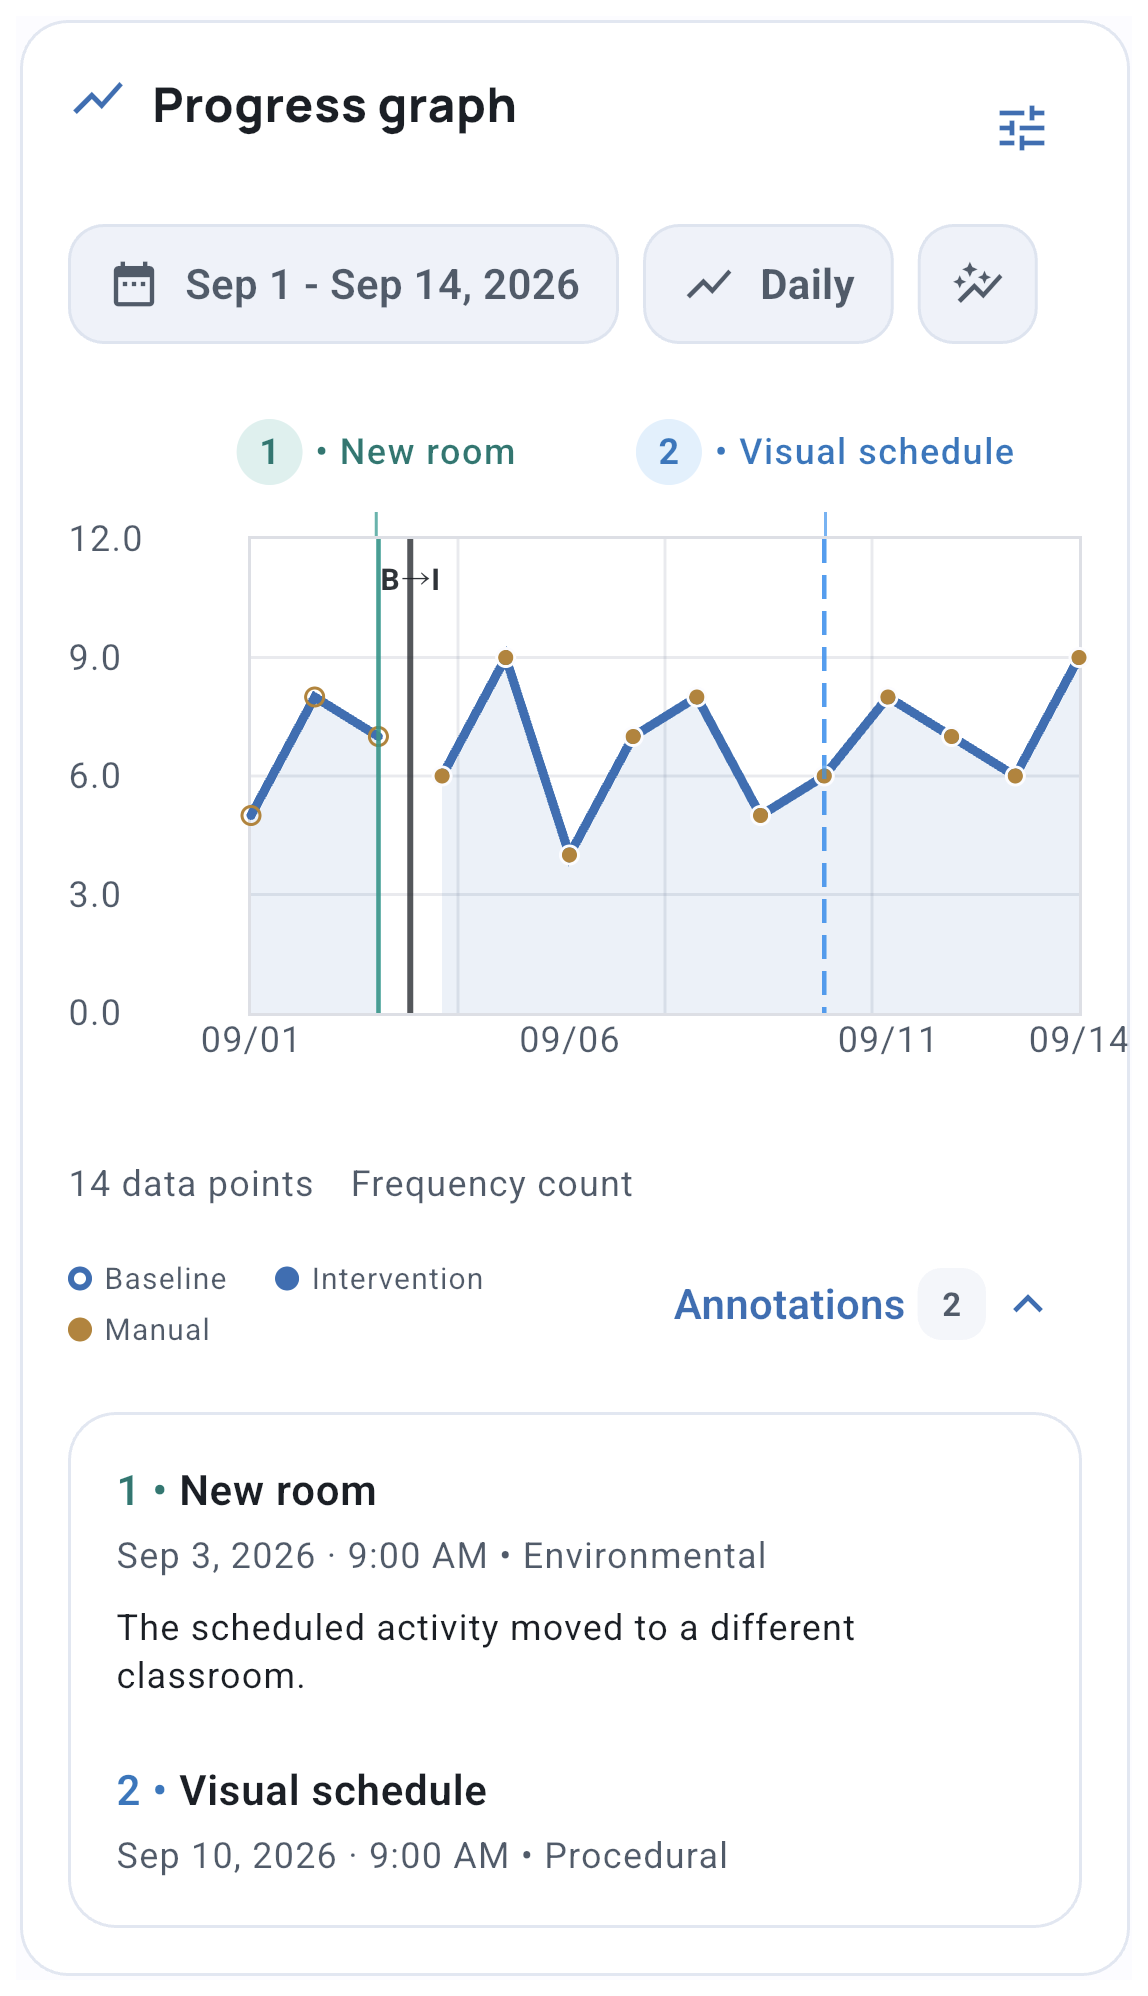
Add an annotation
From the skill or behavior’s options menu, choose Add Annotation. Use This Tracker for context specific to that skill or behavior, or All Trackers for context across the same client’s trackers.
Use View Annotations in that menu to review saved entries. To share this context in a PDF, see Generate Report.
Related guides
- Scatterplot Analysis - Find time-of-day behavior patterns
- Skills & Behaviors - Set up and manage targets
- Records - Review completed sessions and appointment records