· David Cruz · Schools & Special Education · 8 min read
IEP Progress Monitoring with Behavior Data - Stop Scrambling Before Meetings
Your IEP meetings deserve better than guesswork. Learn how school teams use digital data collection to turn behavior goals into measurable progress.

Key Takeaways
IEP progress monitoring falls apart when data collection isn’t built into daily routines. The schools that do this well don’t rely on memory or end-of-quarter scrambles - they use tools that make collecting and synthesizing behavior data effortless. When data flows automatically into charts and reports, IEP meetings become evidence reviews instead of guessing games. Your students deserve goals backed by real numbers, and their parents deserve updates they can understand.
Jump to: Why Data Falls Apart | What IDEA Requires | Matching Methods to Goals | Getting IEP-Ready
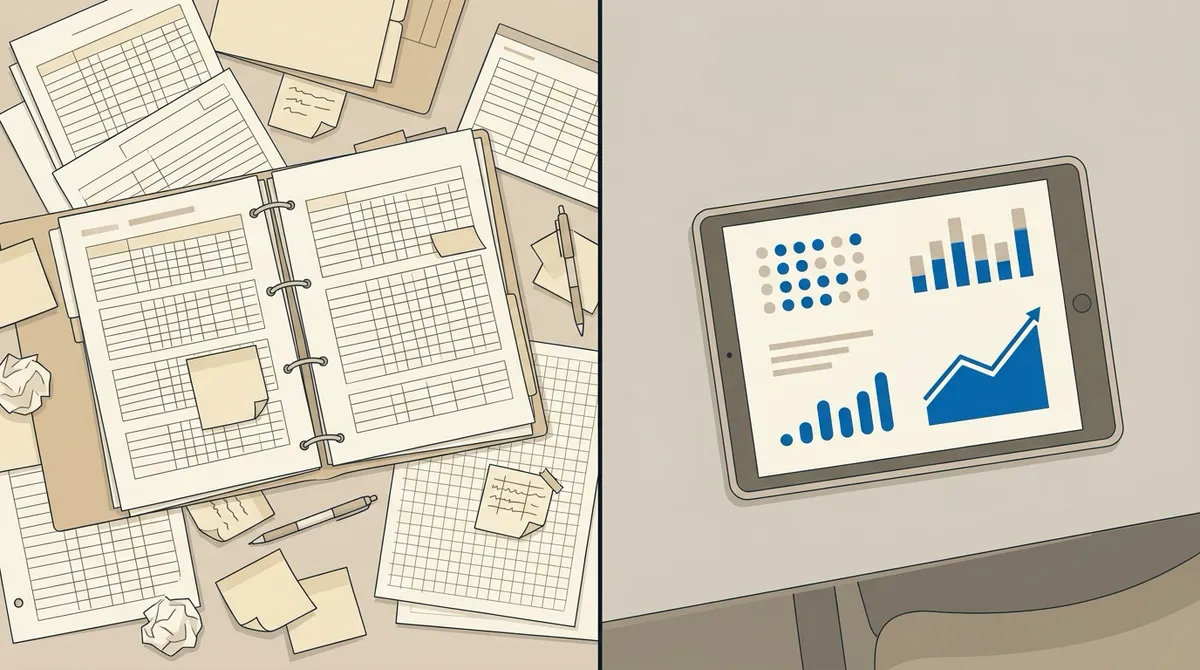
The annual IEP meeting is three days away. You’re searching through folders for behavior data you’re not sure exists. The behavior specialist has some tallies on paper. The paraprofessional remembers things getting better, but can’t point to specifics. The BCBA asks about baseline data and everyone goes quiet.
This scenario plays out in schools constantly. The intent to collect data was there. The execution fell apart somewhere between September and now.
The problem isn’t your team’s commitment - it’s the tools. Paper tally sheets get lost. Spreadsheets require manual entry that never happens. Clipboards don’t sync. By the time someone tries to compile everything, the data is incomplete, inconsistent, or missing entirely.
TallyFlex was built to solve exactly this problem. It’s the ABA data collection app built for school teams who need IEP data ready when they need it, not scrambled together the night before.
Why Data Collection Falls Apart
School teams face real barriers that paper and spreadsheets can’t overcome:
Staffing instability. Paraprofessional turnover is high. Substitute teachers don’t know the protocols. New staff need training before they can collect reliably.
Time constraints. Special education staff juggle instruction, behavior support, paperwork, and data collection simultaneously. Something always gives.
Inconsistent implementation. Different staff record behaviors differently. One person counts “aggression” liberally; another only counts severe incidents.
Technology barriers. Not all classrooms have reliable Wi-Fi. Paper persists because it’s “always available” - but paper doesn’t sync, analyze, or generate charts.
More training on paper methods will not fix this. The better path is digital tools that work on Chromebooks, function offline, and turn raw counts into IEP-ready reports automatically.
What IDEA Actually Requires
Federal law under IDEA (34 CFR 300.320) requires that IEP goals be measurable and that schools monitor progress toward those goals. For behavior-related objectives, this means:
- Baseline data - Where did the student start? Without this, the target is arbitrary.
- Progress monitoring - Is performance improving, flat, or declining?
- Quarterly reporting - Parents must receive progress updates at least as often as general education report cards.
When behavior data collection is inconsistent, several problems emerge:
| Problem | Impact |
|---|---|
| Goals disconnected from reality | Targets too easy (already at 90%) or impossibly hard (starting at 15%) |
| Progress reports lack substance | ”Making progress” tells parents nothing |
| IEP meetings become debates | Competing impressions with no shared data |
| Services adjusted without evidence | Support changes based on assumptions, not demonstrated progress |
Data-backed statements change the conversation. “On-task behavior increased from 45% to 62% this quarter” gives parents real information. “Things seem better” does not.
Matching Recording Methods to Goal Types
Well-written IEP goals specify measurement criteria. That criteria tells you exactly what data to collect - and what TallyFlex recording method to use.
| Goal Language | Data Type | TallyFlex Method |
|---|---|---|
| ”…reduce instances to fewer than 2 per day” | Frequency | Tally counter |
| ”…remain in seat for at least 10 minutes” | Duration | Timer |
| ”…begin work within 30 seconds of instruction” | Latency | Latency timer |
| ”…engaged with instruction for 80% of intervals” (real IEPs often write “on-task” for the same construct) | Interval | Partial/whole interval |
| ”…use coping strategies in 4 of 5 opportunities” | Percent correct | Trial tracking |
| ”…complete steps with minimal prompting” | Task analysis | Step-by-step with prompts |
Each method is built into TallyFlex - no manual setup or spreadsheet formulas required. Select the recording type, define the behavior, and start collecting. The app handles calculations and charting automatically.
For goals involving understanding behavior function, TallyFlex includes ABC data collection (Antecedent-Behavior-Consequence) with one-tap logging.
The Operational Definition Problem
An operational definition describes exactly what counts as the target behavior. Without one, two staff members observing the same student will record different things.
Vague: Track aggressive behavior.
Operational: Record any instance of the student making physical contact with another person using hands, feet, or objects with force sufficient to cause visible marks, an audible reaction, or requiring staff intervention.
In TallyFlex, the operational definition is one long-press away on any tracker during an active session. Every staff member sees the same definition when they check - no hunting for laminated cards or reference binders.
How Often to Collect Data
The quarterly review trap catches many schools: if you only collect data the week before reports are due, you’re not monitoring progress - you’re taking a snapshot.
Recommended approach:
- Daily - High-frequency behaviors (aggression paired with the replacement skill the team is teaching, like requesting a break; engagement during instruction; following routines)
- Per-opportunity - Trial-by-trial goals (coping strategies in 4 of 5 opportunities)
- Weekly - Lower-frequency behaviors or goals spanning the full school year
- Monthly synthesis - Review trends and adjust interventions
- Quarterly reports - Summarize data already collected, not scramble to collect it
With TallyFlex, daily data collection becomes one tap during instruction - not a separate task that competes with teaching time. Data syncs automatically across all staff working with the student.
Preparing Data for IEP Meetings
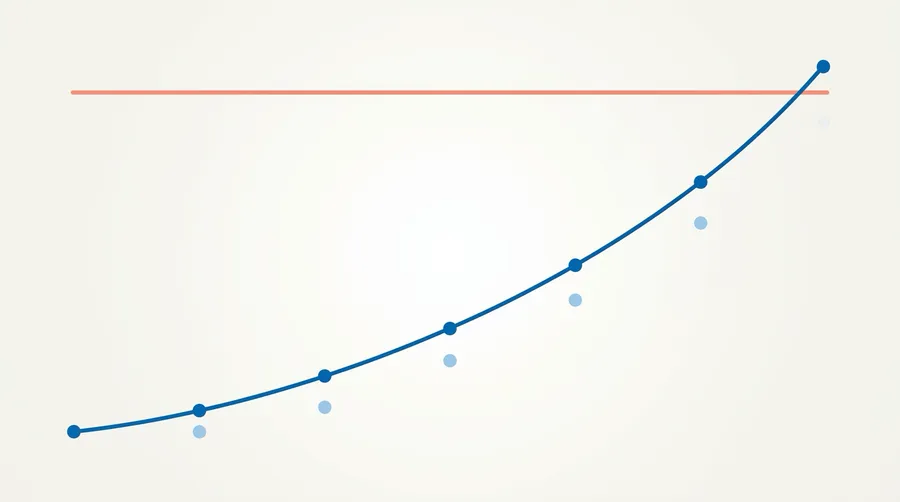
Raw data sheets impress no one. Charts and graphs communicate trends at a glance.
A complete progress report for a behavior goal includes:
- Restatement of the goal - What the student is working toward
- Baseline data - Where the student started
- Current data - Where the student is now
- Trend - Direction of change (increasing, stable, decreasing)
- Rate of progress - Is the student on track to meet the goal by annual review?
- Recommendation - Continue intervention, modify, or goal met
Example: “Goal: Remain on-task for 80% of intervals. Baseline (September): 48%. Current (December): 67%. Trend: Increasing at approximately 6 percentage points per month. Projection: On track to meet 80% target by April. Recommendation: Continue current intervention; consider fading prompts.”
TallyFlex generates this type of report automatically. Data visualization, trend analysis, and export to PDF or Excel - all without manual spreadsheet work.
Communicating Progress to Parents
Parents aren’t behavior analysts. The way you present data matters as much as the data itself.
Translate jargon. For partial interval recording, say “we divided work time into 30-second intervals and marked whether the target behavior happened at any point.” For momentary time sampling, say “we checked at each 30-second cue and recorded what was happening at that moment.”
Connect data to daily life. “82% engaged” is abstract. “During a 30-minute work period, he was engaged with the materials for about 25 minutes” is concrete. If a sample shows the learner stepped away from materials for stretches, name what that signaled (a break-request, a sensory need, a confusing prompt) rather than framing it as failed compliance.
Acknowledge context. Data collected at school may not reflect behavior at home. Parents who see different patterns aren’t wrong - context matters.
Share the why. “We’ve noticed he does better in the morning, so we’re frontloading challenging tasks before lunch” gives parents insight into decision-making.
How TallyFlex Supports School Teams
TallyFlex is the ABA data collection app built for school-based SPED teams who need reliable, always-ready behavior data.
Works on Chromebooks. Unlike many clinical data tools, TallyFlex runs on web, iOS, Android, and Chromebooks. Schools don’t need special devices.
Offline mode. School Wi-Fi is unreliable. TallyFlex works offline and syncs automatically when connectivity returns. No lost data.
Real-time sync across staff. Multiple staff can collect data on the same student. The BCBA reviewing remotely sees the same data as the paraprofessional in the classroom.
Visual progress charts. Built-in charting shows 14-day trends with sparklines. Data becomes presentation-ready for IEP meetings.
CSV and Excel exports. For teams that need to integrate with existing systems or share data in specific formats, exports are one click.
Mastery criteria tracking. Set criteria for goals and see at a glance which objectives are met, in progress, or need attention.
FERPA-ready for district review. Student data is encrypted in transit (TLS 1.3) and at rest (256-bit AES). Schools using Teams with education pricing can request DPA and security documentation.
Documentation shouldn’t follow you home.
Imagine opening your laptop the night before an IEP meeting. Every student’s data is graphed. The report is ready. You’re not printing from 12 different binders.
IEP meetings shouldn’t be guessing games. When data collection is built into daily routines - not treated as a separate task - your team walks into every meeting with evidence, not impressions.
See how TallyFlex works for schools - or try it yourself at app.tallyflex.com. Works on Chromebooks, even offline. IEP data is always ready when you need it.
Questions about implementation? Reach out at support@tallyflex.com. We’re happy to help school teams get started.