· David Cruz · ABA Best Practices · 13 min read
How to Choose the Right ABA Recording Method
Learn when to use frequency, duration, latency, percent correct, task analysis, partial interval, whole interval, ABC data, or momentary time sampling for any behavior.

Key Takeaways
Choosing the right ABA recording method comes down to three questions: What are you measuring? What dimension matters? What’s your treatment goal? For skill acquisition, use Percent Correct for single responses or Task Analysis for multi-step skills. For behaviors, use Frequency if countable, Duration for length, Latency for speed. For high-rate or continuous behaviors, use Partial Interval for reduction goals and Whole Interval for increase goals.
Every clinical decision in Applied Behavior Analysis depends on accurate data. But before you can collect accurate data, you need to choose the right recording method.
This guide covers the nine core recording methods and when to use each one, aligned with Cooper, Heron & Heward’s Applied Behavior Analysis and BACB measurement standards. Whether you’re a BCBA designing a treatment plan, an RBT preparing for a session, or a graduate student studying for the BCBA exam, you’ll learn to make confident decisions about data collection.
Quick Reference
| Method | Measures | Best For | Key Consideration |
|---|---|---|---|
| Frequency | Count of occurrences | Hitting, requests, elopement | Must be discrete and countable |
| Duration | How long it lasts | Dysregulation episodes (bundled), attention, independent play | Requires clear start/stop |
| Latency | Time to respond | Following instructions, transitions | Needs defined antecedent |
| Percent Correct | Accuracy ratio | DTT, skill acquisition | Requires structured trials |
| Task Analysis | Independence/step | Daily living, vocational, chaining | Multi-step skills with prompts |
| Partial Interval | Occurred at all? | Vocal disruption during instruction; high-rate SIB (with safety justification, paired with FCT) | Overestimates; use for reduction; ethics caveat in Section 6 |
| Whole Interval | Occurred throughout? | On-task, engagement | Underestimates; use for increase |
| ABC Data | Function/context | Triggers, reinforcers, BIP development | Descriptive, not experimental |
| Momentary Time Sampling | Present at moment? | High-rate, classroom observation | Unbiased estimate; samples only |
Whichever method you choose, the hard part is collecting it consistently during active sessions. TallyFlex supports all nine recording methods in one app - with automatic timers for interval recording, one-tap prompt tracking for task analysis, and real-time sync across your team’s devices.
Prefer a guided path? The Recording Method Finder walks through the same decision tree in three questions. Need the tap-by-tap workflow after you choose? The recording methods documentation shows how each tile works during a live session.
The Nine Core Recording Methods
1. Frequency Recording
What it measures: The number of times a behavior occurs
Best for: Hitting, kicking, requests, elopement attempts, hand raises, greetings
Requirements: The behavior must have a clear beginning and end and happen at a countable rate (not continuous).
Example: During a 30-minute session, you count 8 instances of vocal disruption above conversational volume during instruction. Your data point is “8 occurrences” or “0.27 per minute” if calculating rate.
Rate vs. count: Report raw count when session lengths are consistent. Report rate (count ÷ time) when sessions vary in length. For example, 8 occurrences in 30 minutes (0.27/min) is directly comparable to 12 occurrences in 60 minutes (0.20/min). Rate enables accurate visual analysis across variable session durations.
Key distinction from Percent Correct: Frequency counts occurrences in natural environments without defined trials. If you have structured teaching with discrete opportunities, use percent correct instead.
2. Duration Recording
What it measures: How long a behavior lasts
Best for: Dysregulation episodes (operationally defined as a bundle - see Example 2), sustained attention, independent play, time in designated area
Requirements: The behavior must have a clear beginning and end, and length is the relevant dimension.
Example: A student has a dysregulation episode lasting 4 minutes 23 seconds, then another lasting 2 minutes 10 seconds (each episode bundled per the operational definition in Example 2). Total duration: 6 minutes 33 seconds.
Key distinction from Whole Interval: Duration measures exact time. If you need precise measurement, use duration. If estimating sustained behavior through sampling, use whole interval.
3. Latency Recording
What it measures: Time between an instruction and the response
Best for: Following directions, transitions, response to name, responding to teacher instruction
Requirements: There must be a clear antecedent (usually an instruction) and a clear response onset.
Example: You say “Touch nose.” The student responds 3.2 seconds later. That’s your latency data point.
Why it matters: A student responding correctly 100% of the time with 45-second latencies needs different intervention than one responding in 2 seconds. Latency measures fluency.
4. Percent Correct
What it measures: Ratio of correct to incorrect responses during structured teaching
Best for: Discrete Trial Training (DTT), skill acquisition, receptive identification, expressive labeling
Requirements: You must have defined trials with clear correct/incorrect criteria. You need a denominator.
Example: During color identification, you present 10 trials. Student correctly identifies 7 colors. Your data: 70% correct (7/10).
Critical distinction: “Asked for help 5 times” is frequency. “Correctly asked for help in 5 of 8 opportunities” is percent correct. You can’t calculate accuracy without knowing total opportunities.
5. Task Analysis
What it measures: Independence level at each step of a multi-step skill
Best for: Daily living skills (handwashing, teeth brushing), vocational tasks, chained behaviors, any skill taught through forward or backward chaining
Requirements: The skill must have distinct, sequential steps that can be broken down and taught individually.
Example: Teaching handwashing with 8 steps (turn on water, wet hands, apply soap, etc.). For each step, record the prompt level needed: Independent (I), Gestural (G), Verbal (V), Model (M), Partial Physical (PP), or Full Physical (FP). (Independent is a trial outcome, not a prompt on the intrusiveness continuum; see Prompt Hierarchy Guide for the corrected framing.)
Prompt hierarchy: Most task analyses use a prompt fading approach. TallyFlex supports customizable prompt hierarchies so you can match your clinical protocol.
Key distinction from Percent Correct: Percent correct tracks accuracy across equivalent trials. Task analysis tracks independence across sequential steps where each step may require different prompt levels.
6. Partial Interval Recording
What it measures: Whether behavior occurred at any point during an interval
Best for: High-frequency behaviors hard to count where there is a clear harm or learning-access justification - vocal disruption during instruction (paired with hand-raising as the FCT replacement), property destruction during transitions, or aggression during group time. Note: stereotypy, scripting, and similar self-stimulatory behaviors are not appropriate decrease-targets in most cases per current ethical-ABA guidance (Mathur, Renz & Tarbox 2024); track only when there is a documented harm or learning-access justification in the treatment plan. Off-task is better treated as an increase target (“engagement during instruction” via whole interval) than as a decrease target.
How it works: Divide observation into equal intervals. Mark “yes” if behavior occurred at any point, “no” if it never occurred.
Example: You observe for 5 minutes using 15-second intervals (20 total). Mark “yes” for any interval where vocal disruption above conversational volume occurred. Result: 14/20 intervals = 70%.
CRITICAL WARNING: Partial interval overestimates behavior. A 1-second occurrence scores the same as 15 seconds of behavior.
When to use it: Behaviors you want to decrease. It’s conservative for reduction. If data shows decrease, you’re confident behavior actually decreased.
7. Whole Interval Recording
What it measures: Whether behavior occurred continuously throughout an entire interval
Best for: On-task behavior, sustained engagement, appropriate play, attending to instructor
How it works: Mark “yes” only if behavior occurred for the entire interval. Any gap = “no.”
Example: You observe for 5 minutes using 15-second intervals. Student was on-task the entire 15 seconds in 12 of 20 intervals. Result: 60%.
CRITICAL WARNING: Whole interval underestimates behavior. A student on-task for 14.9 of 15 seconds scores “no.”
When to use it: Behaviors you want to increase. It’s conservative for improvement. If data shows increase, you’re confident behavior actually improved. See our complete whole interval guide for implementation details.
8. ABC Data (Antecedent-Behavior-Consequence)
What it measures: The relationship between what happens before a behavior, the behavior itself, and what happens after
Best for: Understanding behavior function, identifying triggers and reinforcers, informing Behavior Intervention Plans (BIPs)
Requirements: You must observe the full sequence - what preceded the behavior, the behavior itself, and the immediate consequence.
Example: Antecedent: Teacher presents math worksheet. Behavior: Student crumples paper and pushes it off desk. Consequence: Teacher redirects student to a different task. Over multiple entries, a pattern emerges - escape from non-preferred tasks is likely maintaining the behavior.
Key considerations: ABC data is descriptive, not experimental. It generates hypotheses about function but doesn’t confirm them. Collect enough entries (typically 10-15 across contexts) to identify reliable patterns. One-tap ABC logging in TallyFlex makes it practical to capture entries during active sessions without disrupting instruction.
9. Momentary Time Sampling
What it measures: Whether a behavior is occurring at a specific moment in time
Best for: High-rate behaviors in classroom observation, on-task monitoring across multiple students, behaviors where continuous recording is impractical
How it works: Set fixed intervals (for example, every 2 minutes). At the exact moment each interval ends, observe whether the behavior is occurring. Record “yes” or “no” based only on that instant - not what happened during the interval.
Example: You’re monitoring on-task behavior during a 30-minute independent work period using 2-minute intervals. At each 2-minute mark, you glance at the student. If they’re working at that exact moment, mark “yes.” If they’re looking around, mark “no.” After 15 checks, 11 are “yes” - 73% on-task.
Key considerations: Momentary time sampling provides an unbiased estimate of behavior when intervals are appropriately spaced. Unlike partial or whole interval recording, it neither systematically overestimates nor underestimates. TallyFlex uses a full-screen overlay with a brief 15-second response window at each interval, so you won’t miss a check.
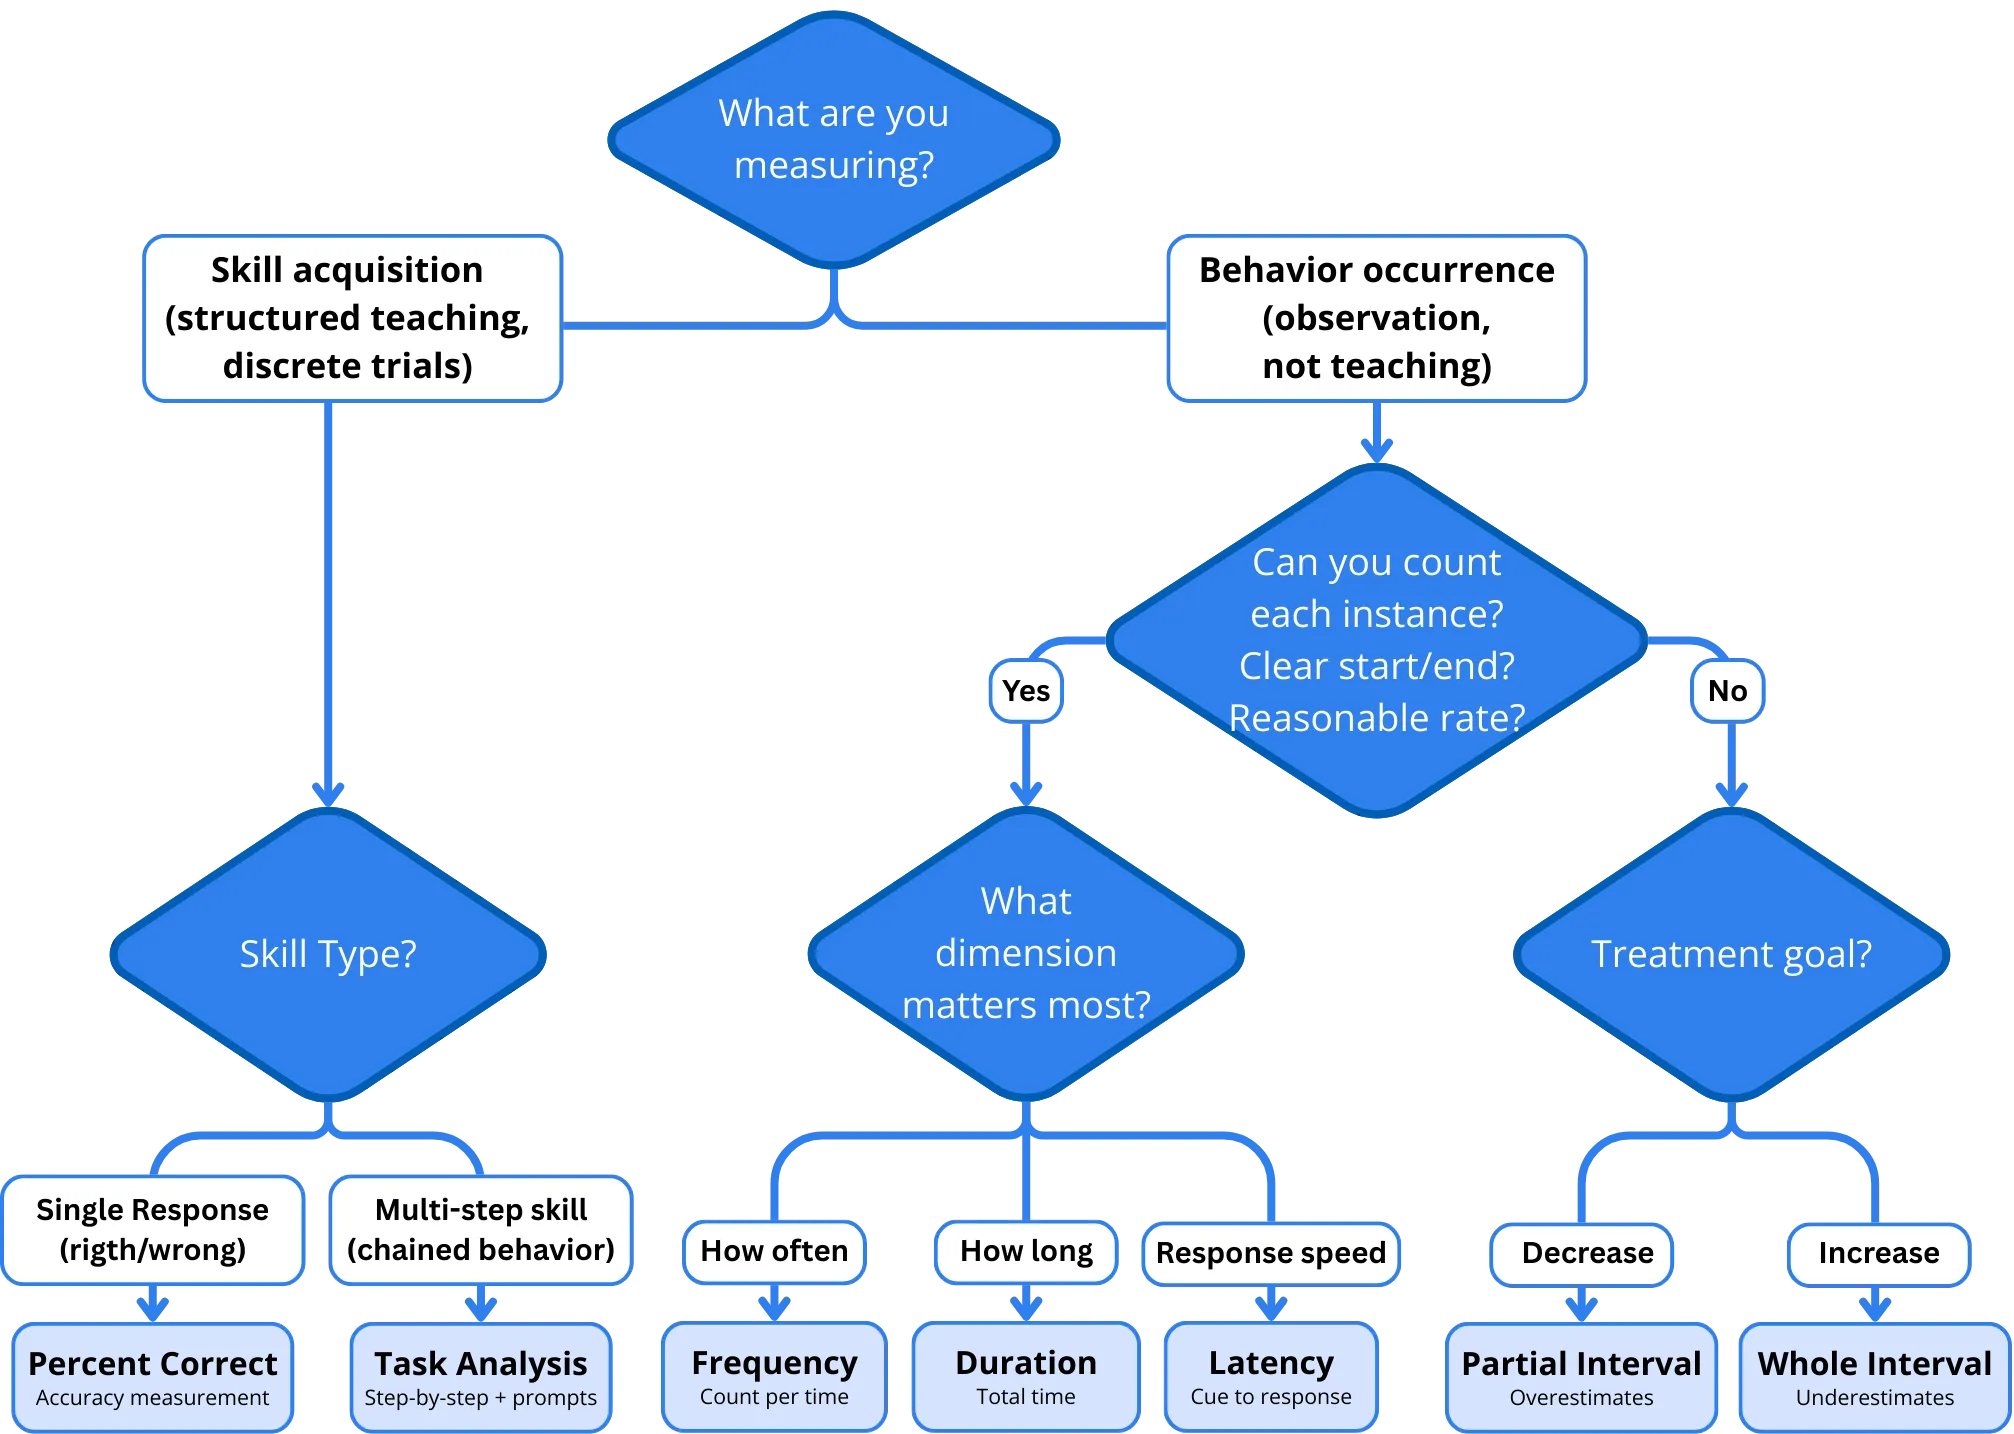
The Decision Framework
Follow this three-question path to choose the right recording method for any behavior or skill.
Question 1: What are you measuring?
Skill acquisition or behavior occurrence?
- Skill acquisition - Structured teaching with defined opportunities → Go to Question 2a
- Behavior occurrence - Natural environment without structured trials → Go to Question 2b
Question 2a: What type of skill?
Single responses or multi-step?
- Single responses (e.g., identifying colors, naming objects, following 1-step directions) → Percent Correct
- Multi-step skills (e.g., handwashing, getting dressed, task completion) → Task Analysis
Question 2b: Can you count each instance?
Is the behavior discrete and countable?
- Yes - Clear beginning and end, occurs at countable rate → Go to Question 3
- No - Continuous or very high-rate → Go to Question 4
Question 3: What dimension matters?
Which aspect is clinically relevant?
- How often it occurs → Frequency
- How long it lasts → Duration
- How quickly they respond → Latency
Question 4: What’s your treatment goal?
Increase or decrease the behavior?
- Decrease (e.g., vocal disruption during instruction, property destruction, high-rate SIB with safety justification - paired with replacement-behavior teaching) → Partial Interval (overestimates, conservative for reduction)
- Increase (e.g., engagement, on-task, play) → Whole Interval (underestimates, conservative for improvement)
Note: stereotypy, scripting, and similar self-stimulatory behaviors are not appropriate decrease-targets in most cases per Mathur, Renz & Tarbox (2024) and BACB Code 2.14. Track them only when there is a documented harm or learning-access justification - see Section 6 for the full caveat.
Practical Examples
Example 1: Color Identification Program
Skill: Student learning to receptively identify colors during DTT
Decision path:
- Q1: What are you measuring? → Skill acquisition
- Q2a: Skill type? → Single responses (each trial is one identification)
Answer: Percent Correct. Present 10 trials, record 7 correct. Data: 70% (7/10).
Example 2: Dysregulation Episodes
Behavior: Dysregulation episode (operationally defined as any episode in which the learner engages in 2+ of the following simultaneously for ≥3 continuous seconds: crying loudly, screaming, throwing objects, hitting/kicking, dropping to floor; episode ends when none of the above are observed for 30 consecutive seconds). Currently triggered most often when academic demands are presented.
Decision path:
- Q1: What are you measuring? → Behavior occurrence
- Q2b: Can you count each instance? → Yes, episodes have a clear start and a 30-second end criterion
- Q3: What dimension matters? → How long (duration data identifies whether antecedent strategies are shortening episodes, even before frequency drops)
Answer: Duration. Track how long each episode lasts. The team is also teaching the learner to request a break when demands are presented (a functional communication training (FCT) request, tracked on a parallel frequency tracker - see ethics caveat in Section 6). The duration graph shows whether antecedent strategies and the FCT request are shortening the episodes.
Example 3: Vocal Disruption During Instruction
Behavior: Student engages in high-rate vocal disruption above conversational volume during teacher instruction (operationally defined as audible-at-3-feet vocalization during teacher instruction or peer turn that is not directed-responsively to the speaker; non-examples include whispered self-talk, single-syllable acknowledgments, and hand-raised contributions called on by the teacher). The disruption is documented in the BIP as preventing access to instruction for the learner and peers (learning-access criterion met per Mathur, Renz & Tarbox 2024).
Decision path:
- Q1: What are you measuring? → Behavior occurrence
- Q2b: Can you count each instance? → No, occurs almost continuously
- Q4: Treatment goal? → Decrease (paired with hand-raising as the replacement behavior, tracked on a parallel frequency tracker)
Answer: Partial Interval. Use 15-second intervals. Mark any interval where vocal disruption occurred. You accept overestimation because you’re conservative about improvement. Hand-raising frequency is reported alongside on the same report so the team can see the replacement skill grow as the disruption shrinks.
Example 4: On-Task Behavior
Behavior: Student sitting in seat and working on assigned task.
Decision path:
- Q1: What are you measuring? → Behavior occurrence
- Q2b: Can you count each instance? → No, this is a sustained state behavior
- Q4: Treatment goal? → Increase
Answer: Whole Interval. Use 15-second intervals. Mark “yes” only if student was on-task the entire interval. You accept underestimation because you’re conservative about reporting improvement.
Example 5: Handwashing
Skill: Teaching 8-step handwashing routine (turn on water, wet hands, apply soap, etc.)
Decision path:
- Q1: What are you measuring? → Skill acquisition
- Q2a: Skill type? → Multi-step skill
Answer: Task Analysis. Record prompt level needed for each step: Independent, Gestural, Verbal, Model, Partial Physical, or Full Physical.
Common Mistakes to Avoid
These errors undermine data validity.
1. Using Frequency for Non-Discrete Behaviors
Mistake: Trying to count a behavior that occurs almost continuously (for example, vocal disruption during instruction at very high rate)
Solution: Use partial interval recording instead, with the ethics caveats from Section 6
2. Using Percent Correct Without Trials
Mistake: Recording “80% correct” when you didn’t structure discrete trials
Solution: Either structure trials or track frequency in natural environment
3. Using Wrong Interval Type
Mistake: Using whole interval for behavior you want to decrease
Why it’s wrong: Whole interval underestimates, making reductions look more dramatic than reality
Solution: Use partial interval for behavior reduction
4. Mixing Methods Mid-Program
Mistake: Starting with frequency, switching to partial interval halfway through
Solution: Choose one method and stick with it. You can’t compare across methods.
Making the Method Usable During Real Sessions
Choosing the right method is only the first step. The method still has to survive the session: interruptions, transitions, multiple trackers, and team members who need to collect data the same way.
TallyFlex keeps the nine recording methods in one session interface, with automatic timestamps, offline collection, and the same tracker setup available across devices. Once the method is chosen, the next job is consistency.
Train Your Team Around One Workflow
- Define the behavior operationally. Everyone must measure the same thing.
- Practice together. Collect simultaneously, compare results, and clarify edge cases before the data matters.
- Use the same tracker setup. Keep the recording method, interval length, prompt levels, and mastery criteria consistent across staff.
- Review data patterns. Teach interpretation, not just collection.
For the product workflow, start with Choosing a Recording Method, then use Recording Methods During Sessions for the tap-by-tap session guide.
What’s Next?
- Try the interactive tool: Recording Method Finder walks you through this exact decision framework for your specific behavior
- Set it up in the app: Choosing a Recording Method shows the setup workflow
- Use it during sessions: Recording Methods During Sessions shows how each tile works once a session starts
- Ready to begin? Start Tracking with all nine recording methods in one interface
The right recording method is the foundation. The right tool helps your team collect it consistently.